Monitoring
EPICOR
DASHBOARD
THE CHALLENGE
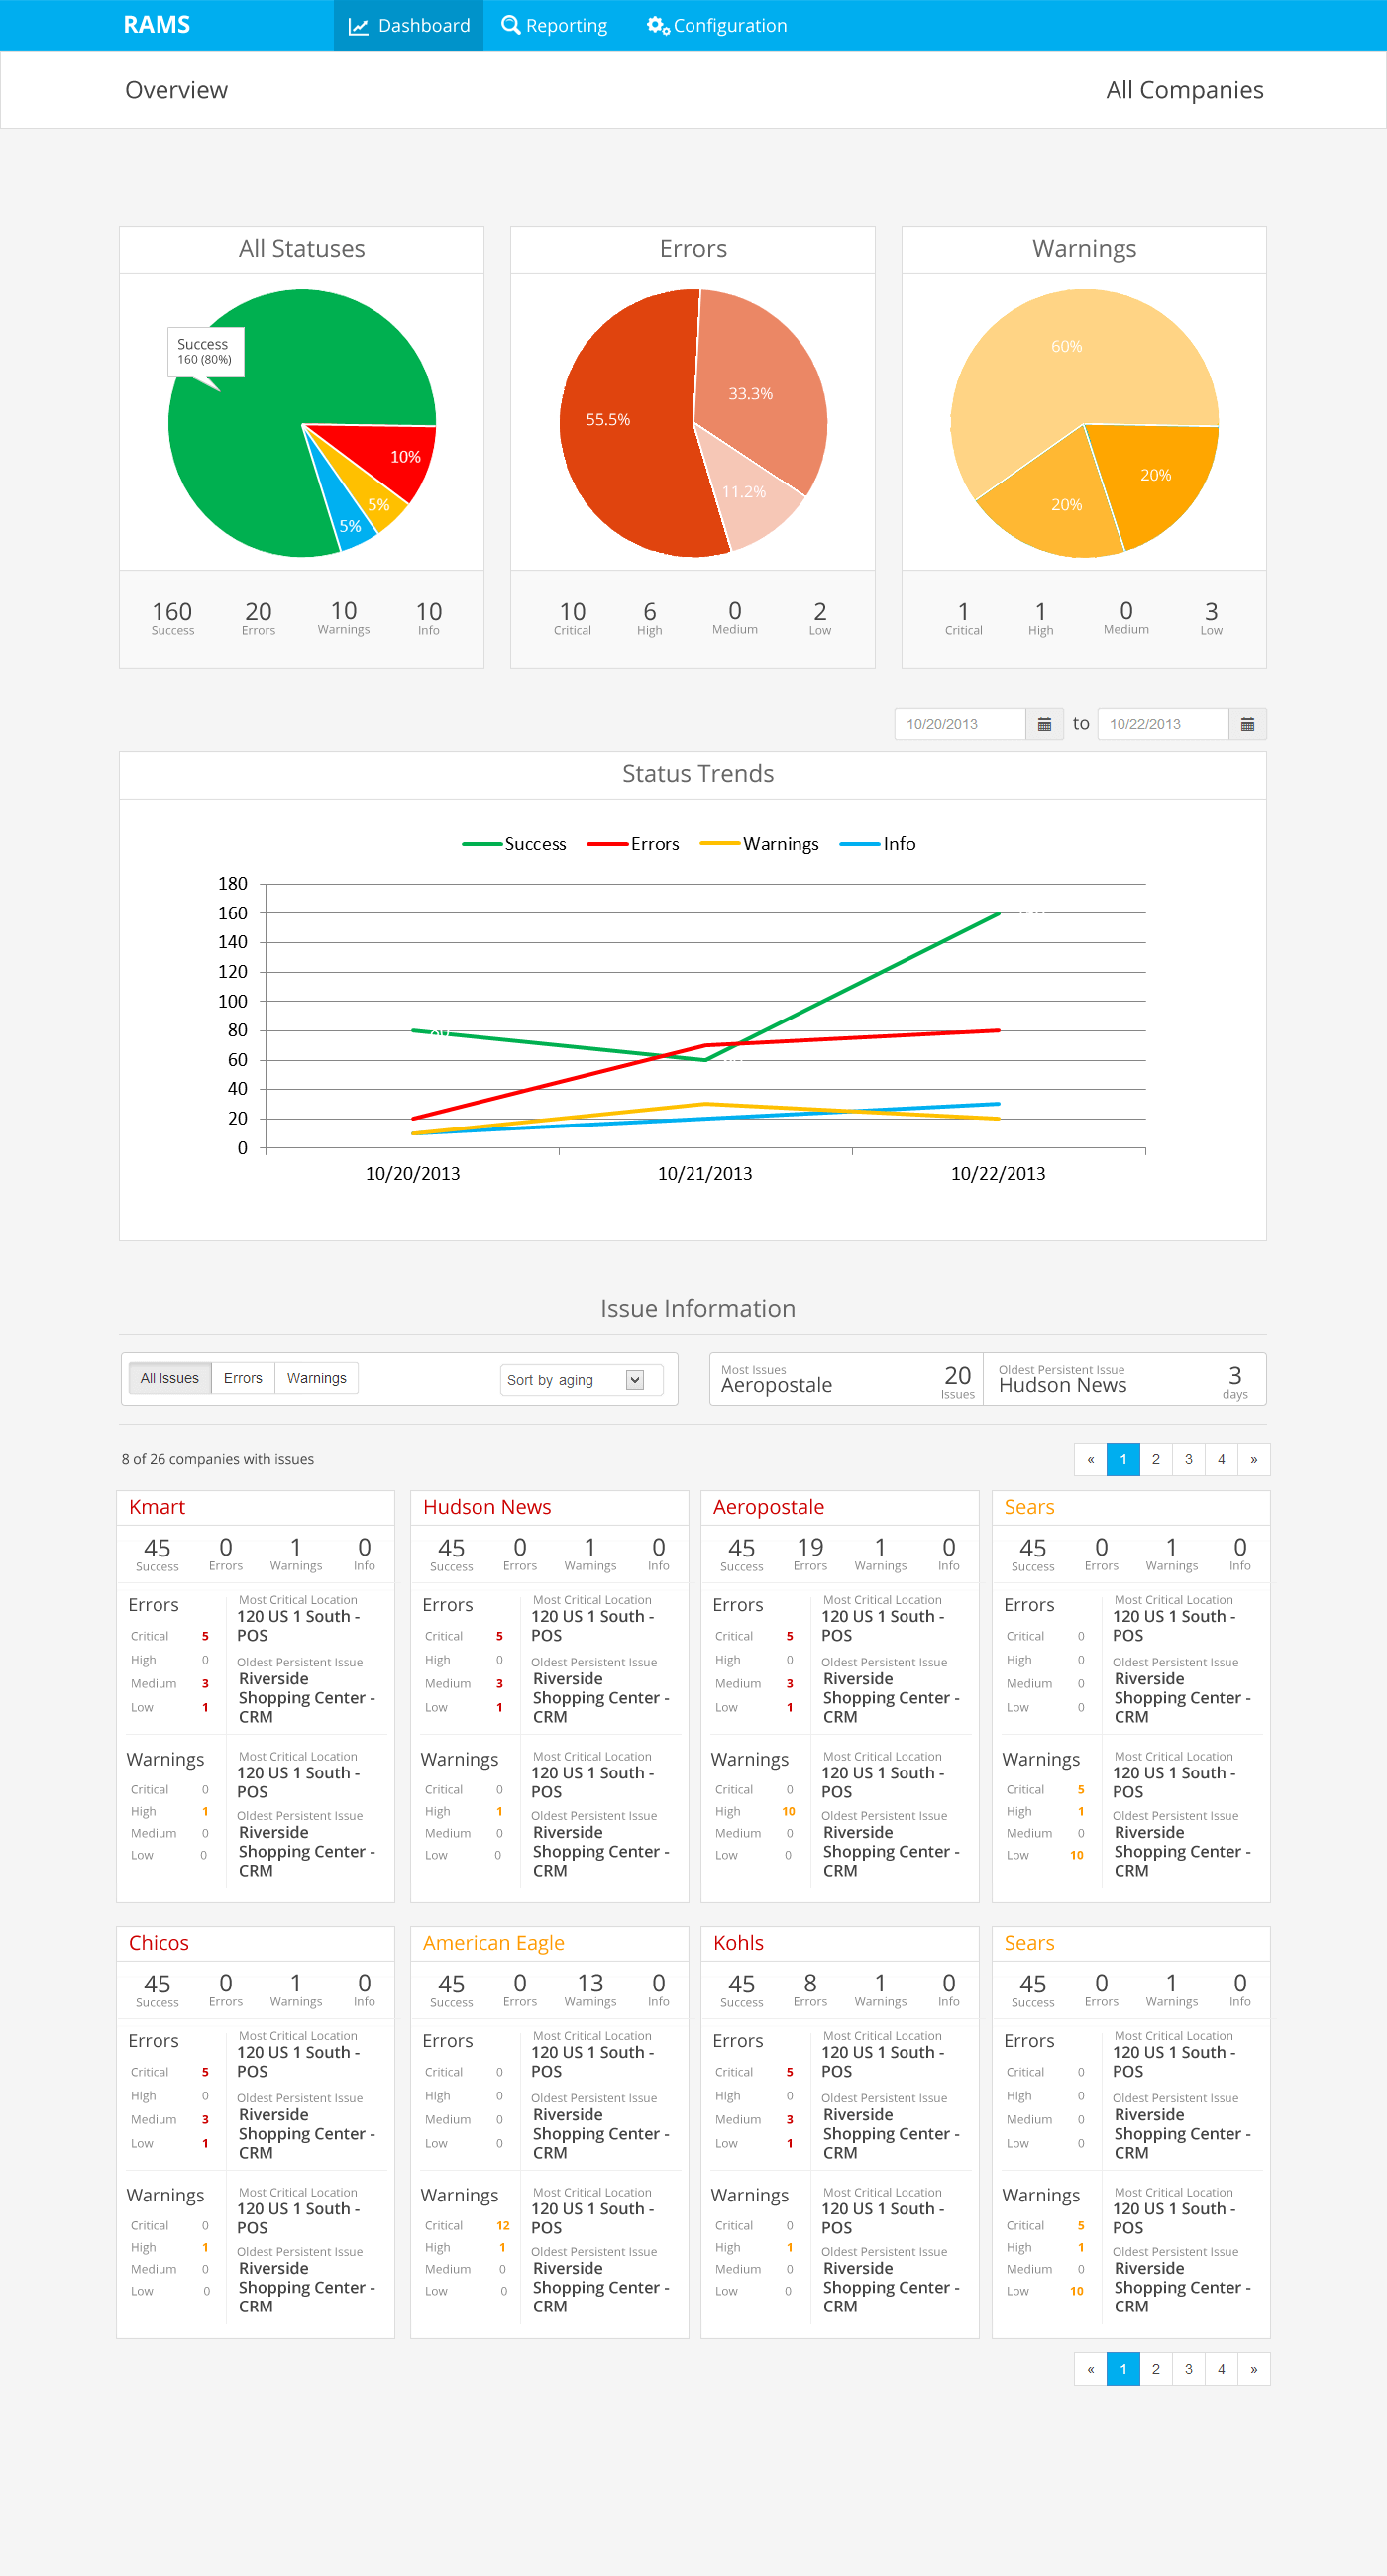
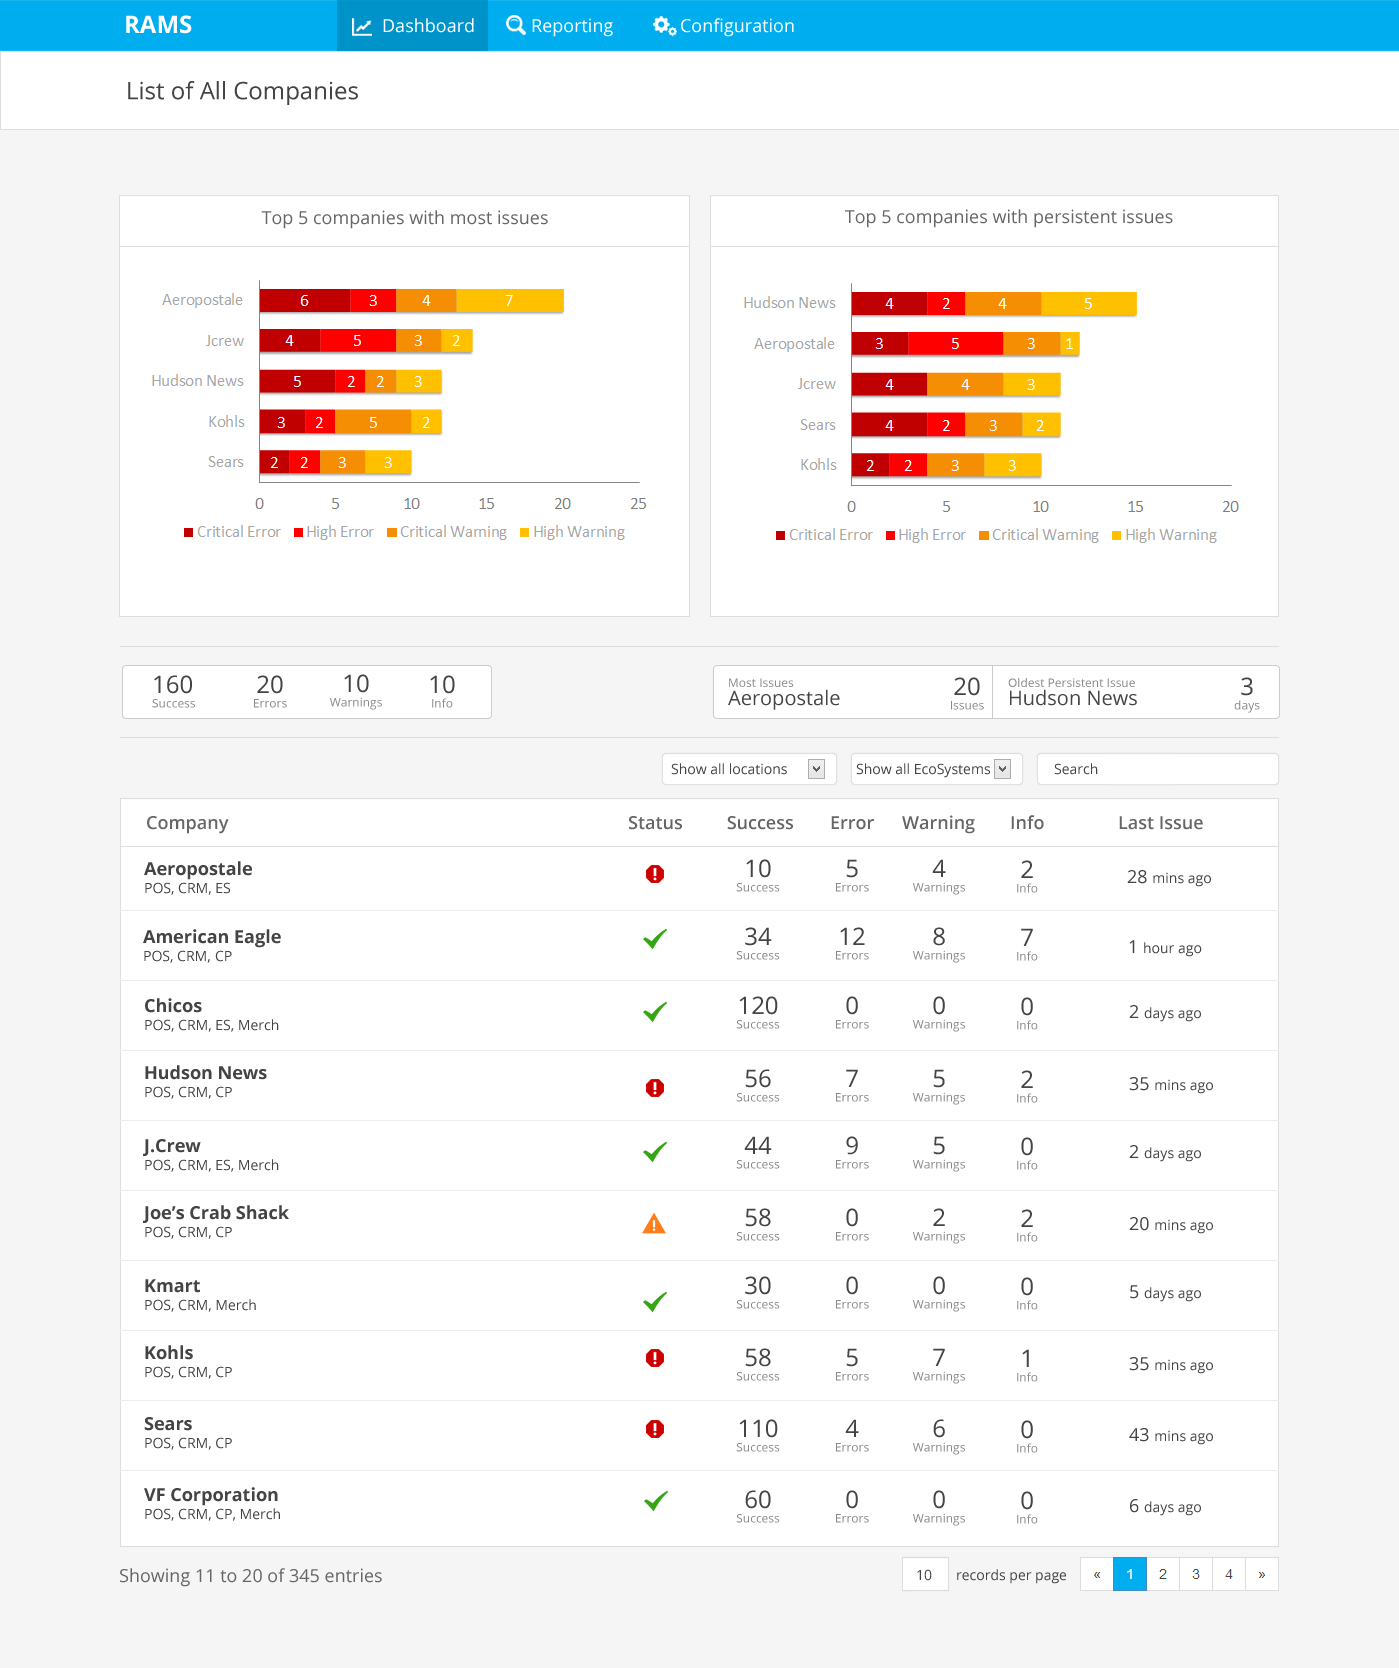
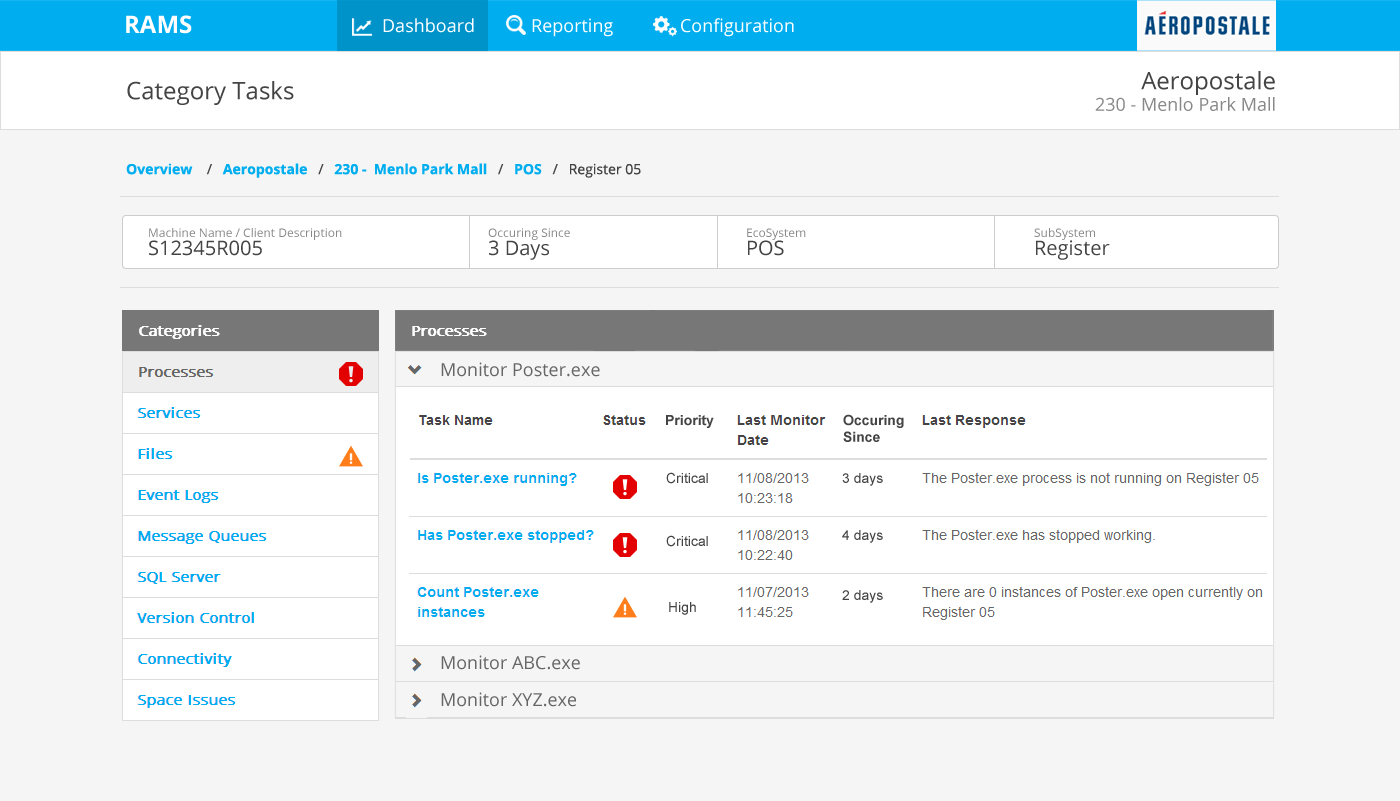
Design a quick and easy way to proactively monitor the health of thousands of Point of Sale and CRM systems. Combine disparate data into intuitive visualizations to reduce ticket creation time and ensure maximum uptime for retailers.
DESIGN APPROACH
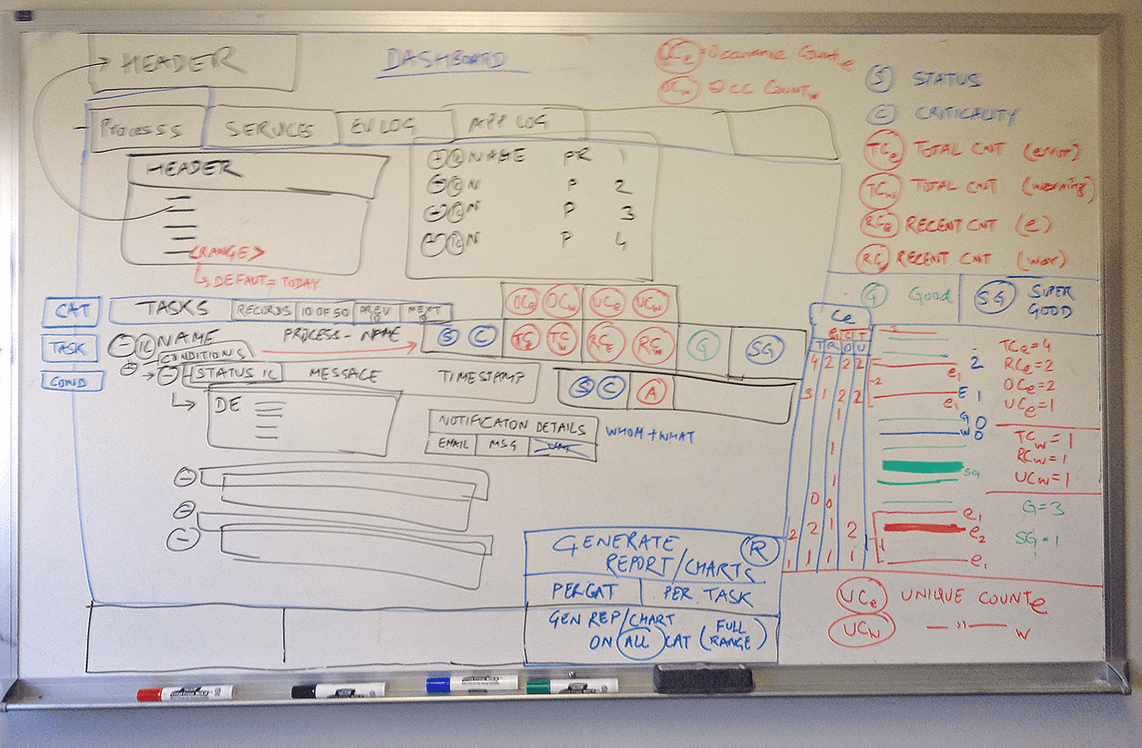
- 01 Whiteboarding sessions to understand complex retail workflows.
- 02 Analyzed existing processes to identify system bottlenecks.
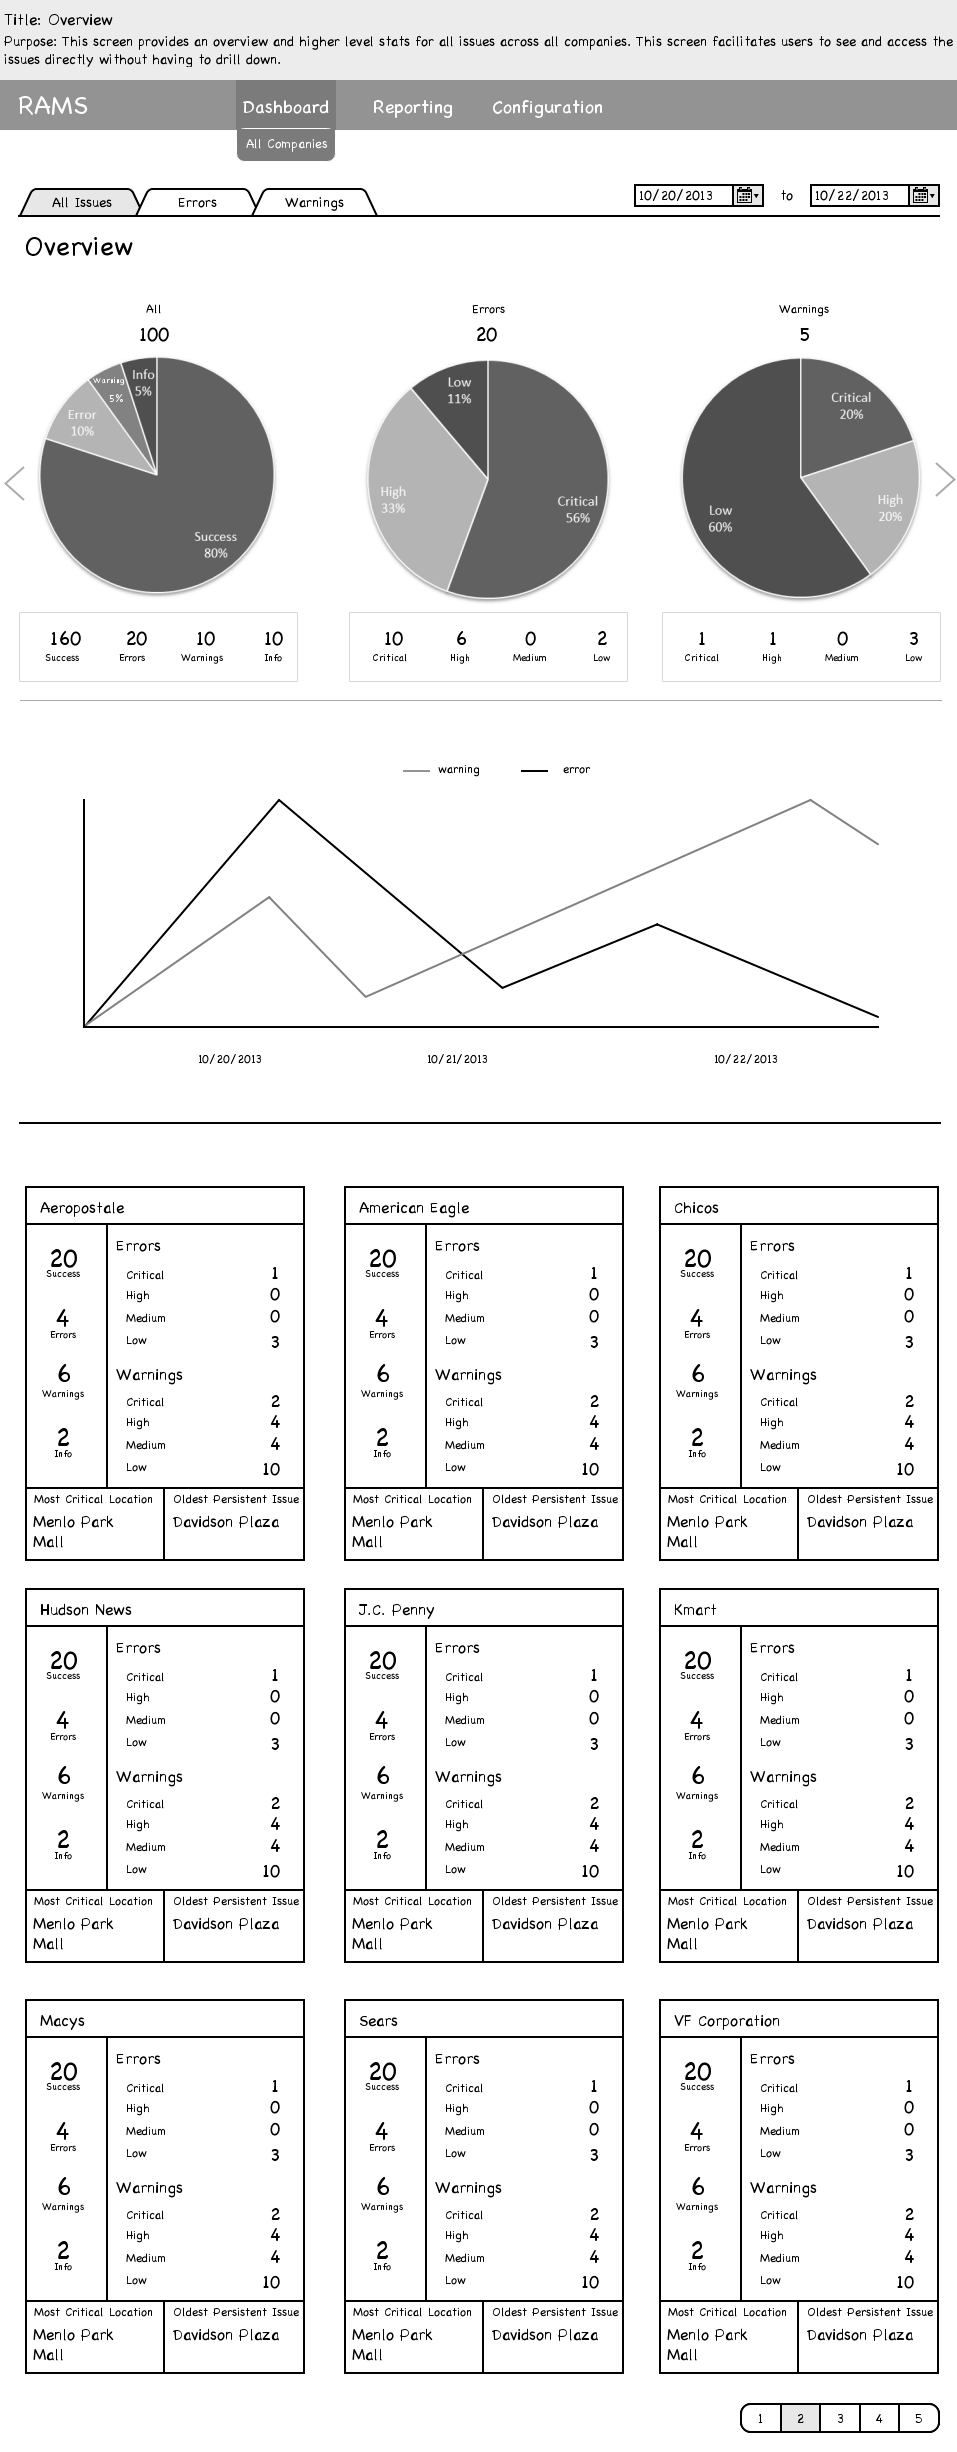
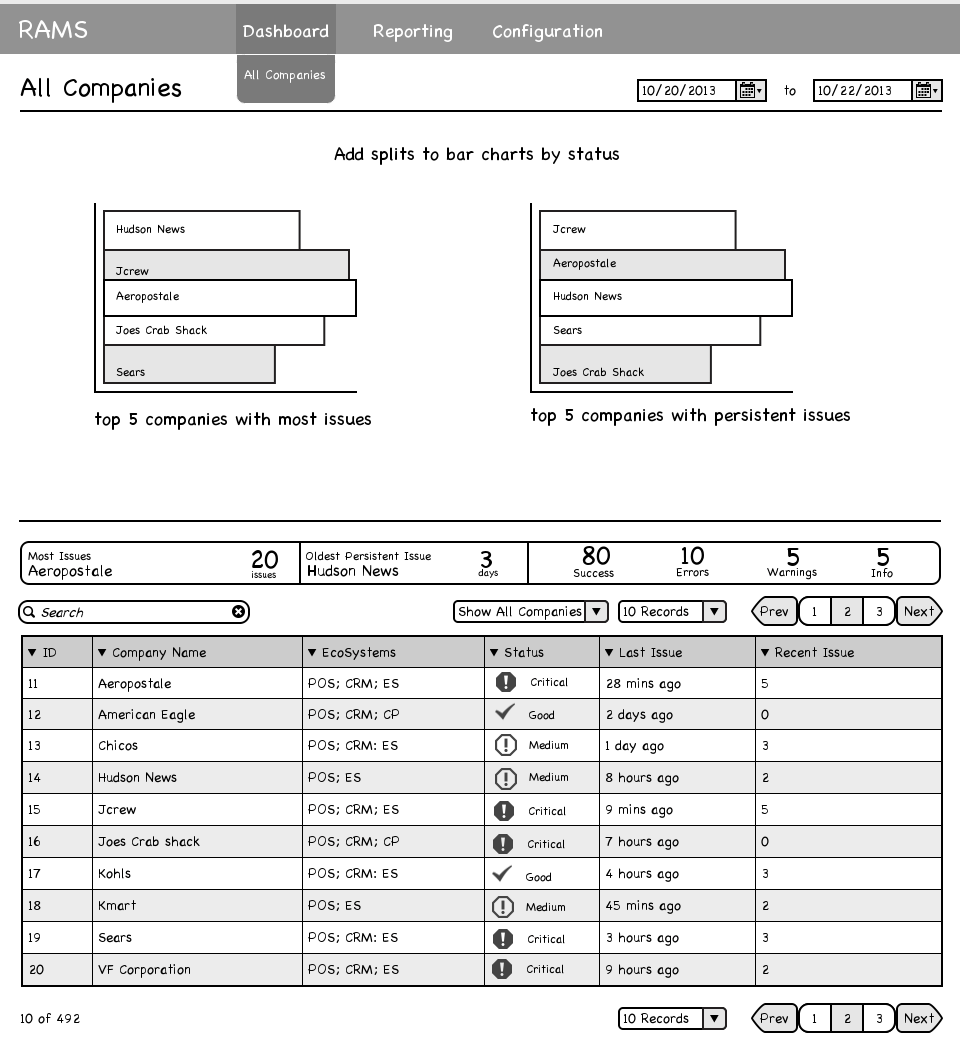
- 03 Created intuitive data visualizations for health metrics.
- 04 Designed prioritization system for critical system failures.
- 05 Rapid prototyping and iteration with technical stakeholders.
KEY IMPACT
15 Min
Avg. Response Time
1000s
Monitored Locations
Billions
Transactions Impact
16X
Efficiency Boost
PROJECT GALLERY

KEY LEARNINGS
"Good data visualization can transform how teams respond to crises. By designing interfaces that prioritize critical information and reduce cognitive load, we can dramatically improve response times and prevent larger issues."